
The goal of this post is to enhance the chatbot developed in the previous post by introducing an agent capable of using a tool to retrieve information from the internet whenever needed. In addition, LangSmith is presented as an observability layer, enabling the tracking of agent executions and the analysis of each step of the agent’s interactions. For this reason, reading the previous post is highly recommended before proceeding with this content.
This post covers the following topics:
- An introduction to LangSmith
- Environment setup
- Chatbot creation with tool-enabled agents
- Analysis of execution tracing in LangSmith
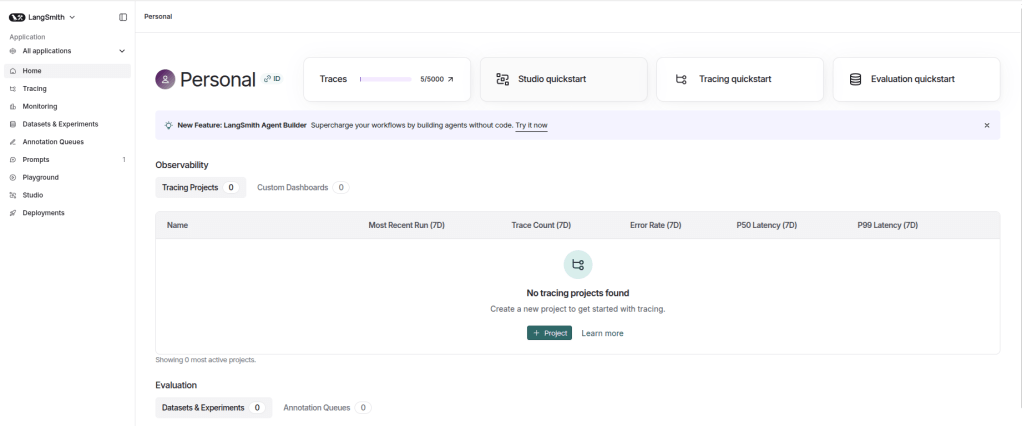
An introduction to LangSmith
LangSmith is an observability, evaluation, and debugging platform for LLM-based AI systems. Its purpose is to simplify setup and provide detailed visibility into the behavior of agents and AI workflows, regardless of how the application was built.
LangSmith provides several key features:
- Tracing: One of LangSmith’s core capabilities is detailed execution tracing. It offers a structured and hierarchical view of the application flow, allowing inspection of inputs and outputs at each component, such as model calls, tool executions, retrieved documents, etc. This makes it easier to identify bottlenecks, logical errors, quality degradation, and to fully understand how a specific result was generated.
- Playground e Prompts: The playground serves as an experimentation environment where different models can be tested and the system prompt can be adjusted to observe how changes affect behavior and response quality. Once validated, prompts can be saved in the Prompts section of LangSmith. This feature enables prompt storage and versioning over time, supporting change management and collaboration. Saved prompts can also be imported directly into the application via the LangSmith API, avoiding hard-coding and ensuring the correct prompt version is used.
- Datasets e Experiments: LangSmith supports offline evaluation through datasets and experiments, allowing teams to measure the impact of changes in the application. A dataset is a collection of examples that can be created by uploading CSV or JSON files or manually through the interface. New records can also be added from existing application traces. Experiments leverage these datasets to compare different application versions, such as changes in model, prompt, or agent logic, using automated metrics, LLM-as-a-Judge evaluations, etc.
- Dashboards: Through monitoring capabilities, LangSmith provides high-level insights into application behavior. Metrics such as latency, token usage, and execution volume can be tracked. The platform includes default dashboards for each project and also supports the creation of custom dashboards.
It is important to highlight that LangSmith provides many more features and capabilities than those mentioned above. This section presents only a high-level overview of its core functionalities. Feel free to explore the official documentation to further understand the full potential of the platform.
Environment setup
Python 3.12.9 was used to build the chatbot. Below is the requirements.txt file containing the dependencies required to run the project:
In addition, the .env file must contain the following environment variables:
OPENAI_API_KEY=
TAVILY_API_KEY=
LANGSMITH_TRACING=true
LANGSMITH_API_KEY=
LANGSMITH_PROJECT=Search Agent
The model used in this project is gpt-5-mini from OpenAI, which requires an API key from this provider. Since the chatbot uses an agent capable of retrieving information from the internet, a Tavily API key is also required, as Tavily is the tool responsible for this functionality.
To use LangSmith, application tracing must be enabled (LANGSMITH_TRACING=true), the platform API key must be provided, and a project name (LANGSMITH_PROJECT) must be defined. This project name is used to organize and register executions within the LangSmith environment.
Chatbot creation with tool-enabled agents
Below is the model.py file, responsible for initializing the agent, integrating the web search tool, and managing the application’s memory. Note that this file is very similar to the one presented in the previous post, where each part of the code was explained in detail. Therefore, reading that explanation is highly recommended before proceeding.
from datetime import datetime

from dotenv import load_dotenv
from langchain.agents import create_agent
from langchain.chat_models import init_chat_model
from langchain_core.messages import HumanMessage, AIMessage, SystemMessage
from langchain_tavily import TavilySearch
from langsmith import Client

load_dotenv()

class LLMModel:
    def __init__(self, model_name: str, model_provider: str, temperature: float = 0):
        llm = init_chat_model(
            model=model_name,
            model_provider=model_provider,
            temperature=temperature
        )

        tools = [TavilySearch()]
        self.agent = create_agent(model=llm, tools=tools)

        langsmith_client = Client()

        system_prompt = langsmith_client.pull_prompt("search_agent")
        today_date = datetime.now().strftime("%Y-%m-%d")
        system_prompt = system_prompt.format(today_date=today_date)

        self._messages = [SystemMessage(content=system_prompt)]

    def run(self, query: str):
        self._messages.append(HumanMessage(content=query))

        response = self.agent.invoke({"messages": self._messages})
        response = response["messages"][-1].content

        self._messages.append(AIMessage(content=response))

        return response
Focusing only on the differences compared to the previous post, the first change is that instead of directly using an LLM model, an agent is created using the create_agent method, where the model and tools are provided, in this case, only TavilySearch. Additionally, the system prompt is no longer defined directly in the script. It is retrieved from LangSmith using the pull_prompt method, where the name of the previously created prompt is specified. Finally, in the run method, there is no longer a chain. Instead, the agent is executed using the invoke method, and the generated content is added to memory before being returned.
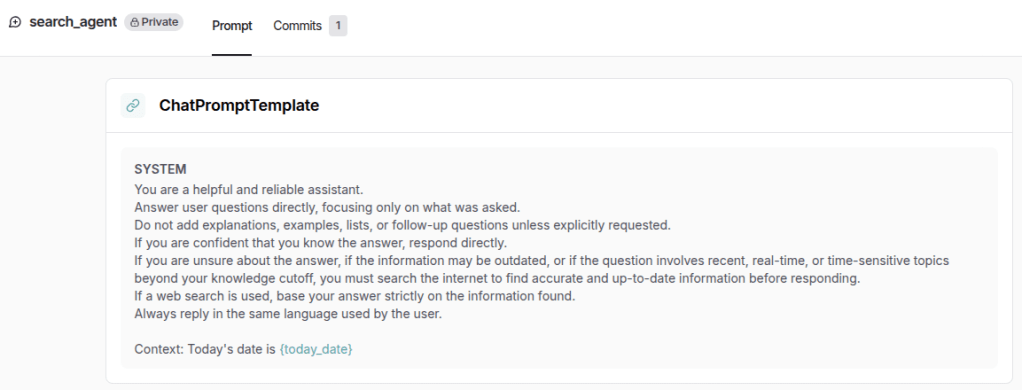
Below is the prompt created in LangSmith, available in the Prompts section. This approach makes it easier to visualize, manage, and version the prompt, while also avoiding hard-coding within the application, as mentioned earlier.
Finally, below is the main.py file, responsible for running the chatbot. It is the same as the one used in the previous post.
from model import LLMModel


llm = LLMModel(
    model_name="gpt-5-mini",
    model_provider="openai",
)

if __name__ == "__main__":
    while True:
        query = input("Ask a question (type 'exit' to quit): ")

        if query.strip().lower() == "exit":
            break

        response = llm.run(query)
        print("Assistant: " + response + "\n------------------------")
Analysis of execution tracing in LangSmith
The purpose of this section is to analyze the traces generated in LangSmith. Below is the conversation produced when executing the main.py file:
Ask a question (type 'exit' to quit): Who was the last player to win the Ballon d'Or?
Assistant: Ousmane Dembélé — he won the Men's Ballon d'Or in 2025.
------------------------
Ask a question (type 'exit' to quit): Which team does he currently play for?
Assistant: He currently plays for Paris Saint-Germain (PSG).
------------------------
Ask a question (type 'exit' to quit): How old is he now?
Assistant: He is 28 years old.
------------------------
Ask a question (type 'exit' to quit): exit
Below are the traces generated under the Search Agent project, which is the name defined in the LANGSMITH_PROJECT environment variable, as mentioned earlier. Note that only 3 traces were generated, corresponding to the 3 interactions performed with the assistant.
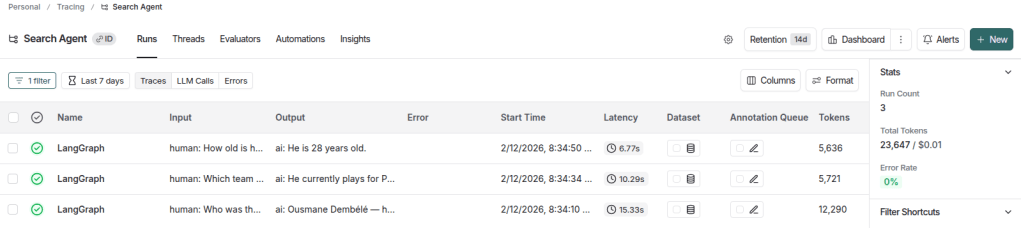
In this view, it is already possible to inspect the latency of each trace, the number of tokens used, and the associated cost (even though it is not visible in the image above, as it appears further to the right), among other relevant information. Additionally, in the Stats section on the sidebar, aggregated metrics are displayed, such as total run count, total token usage, and accumulated project cost.
When clicking on any trace, its details are displayed in a hierarchical tree format. The image below illustrates the first trace, corresponding to the question about the most recent Ballon d’Or winner.
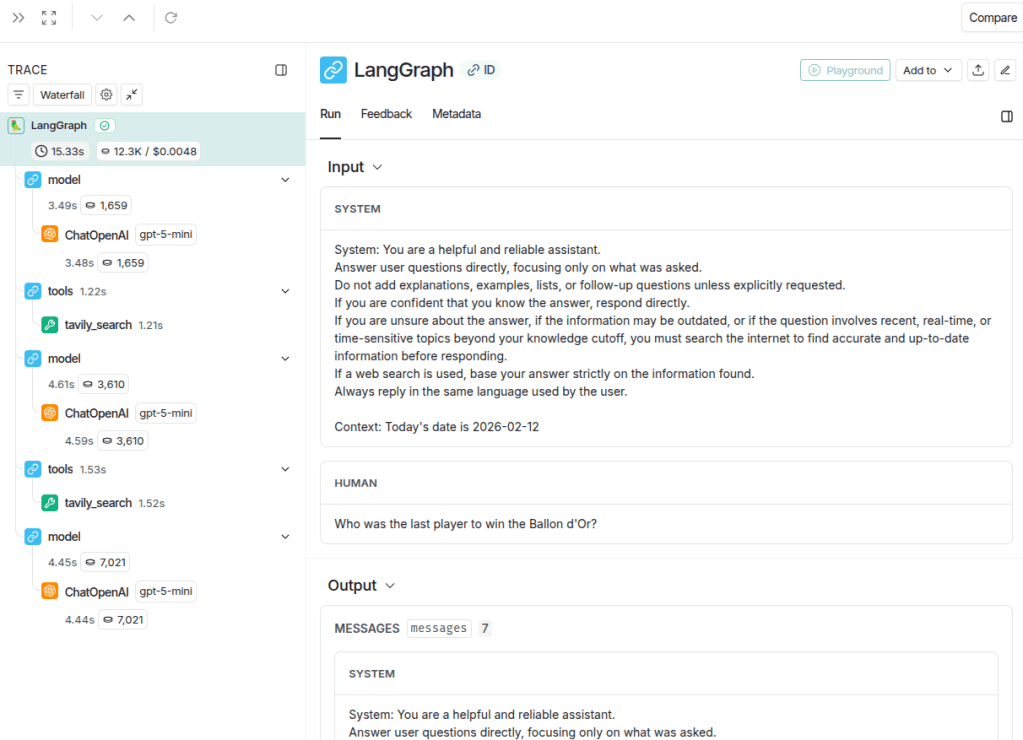
In this view, it is possible to clearly inspect the inputs and outputs of each execution component, such as the agent and the tool, which simplifies the analysis of potential errors or unexpected behavior. The execution tree is displayed in the left sidebar. By selecting the root node, labeled LangGraph, the full trace can be examined, including all inputs and outputs. Additionally, each node in the tree displays specific metrics such as latency, token usage, and cost. These metrics appear as small badges next to each component, providing a quick and structured overview of resource consumption at every step. This makes it easier to identify which part of the workflow contributes most to latency or token usage, whether it is a model call or a tool execution.
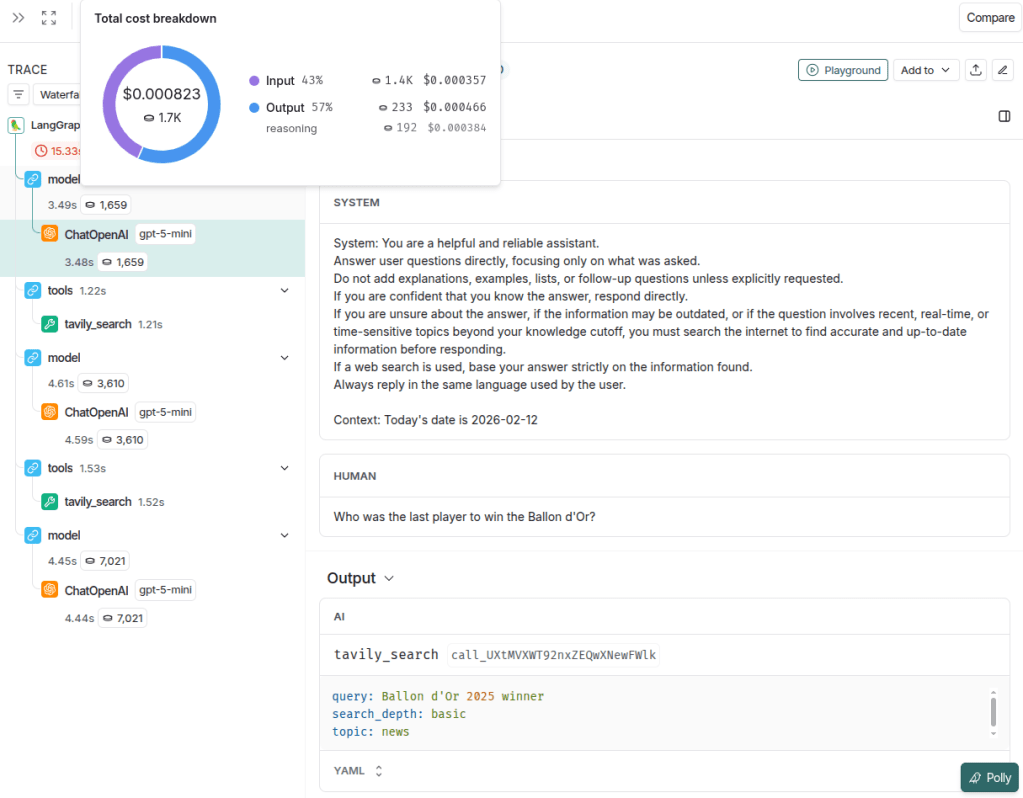
The image below illustrates in detail the first model output, which corresponds to the tool execution call. It is possible to see the messages received by the assistant (system and human), and the resulting output was a call to the tavily_search tool with the query “Ballon d’Or 2025 winner”. Additionally, by hovering over the token metric (1,659 tokens in this example), further details can be viewed, including a donut chart showing the distribution of cost and tokens between input and output, as well as more granular breakdown information. It is also possible to identify the model used in the call (in this case, gpt-5-mini), which is particularly useful in workflows involving multiple LLM calls.
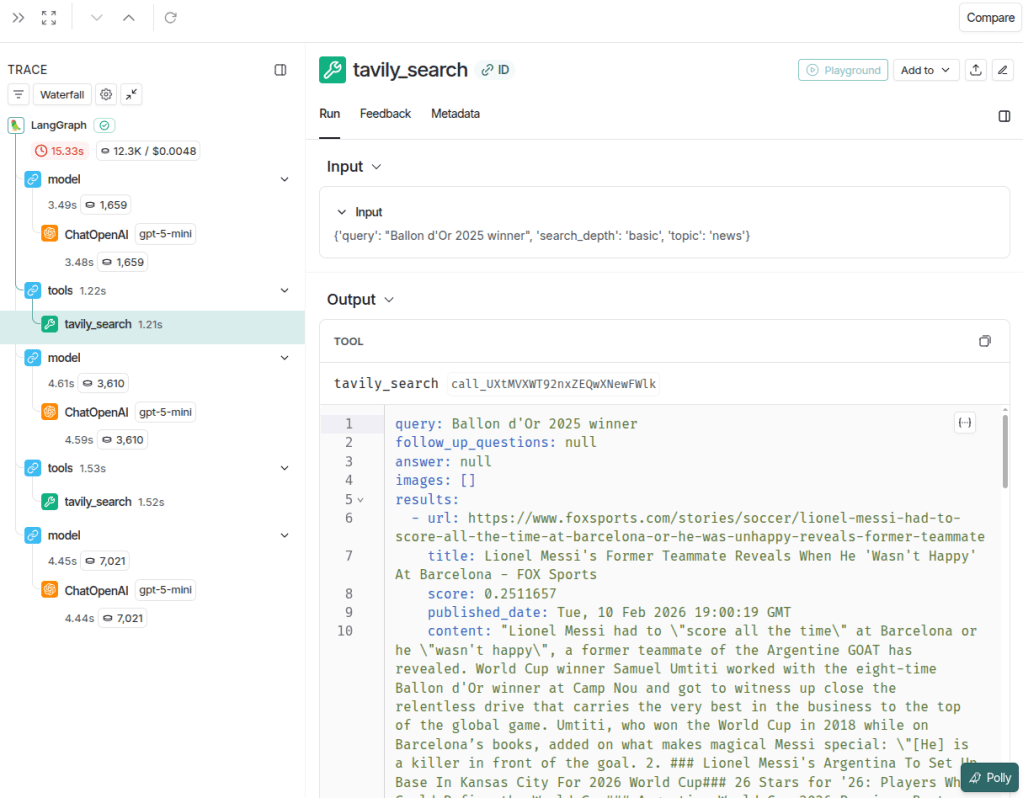
The image below illustrates the input and output of the tavily_search tool. It is possible to inspect the parameters sent by the model, such as query, search_depth, and topic, as well as the execution time of the call (1.22 seconds).
Notice that the assistant made 2 tool calls, indicating that it considered the results from the first search insufficient to answer the question. This behavior can serve as a trigger for chatbot optimization, for example by refining the agent instructions to generate more precise queries or better define search parameters. Doing so can reduce redundant calls, improve response quality, and optimize both cost and latency.
It is also worth highlighting that LangSmith provides a very useful visualization when selecting the Waterfall view, which clearly shows the main components contributing to application latency. The image below illustrates this view.
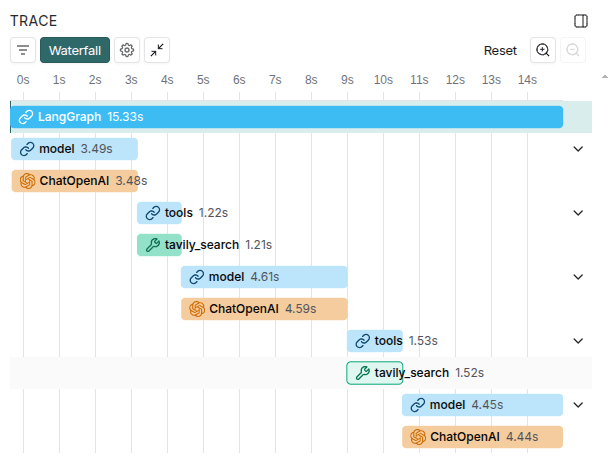
The remaining traces follow a pattern similar to the one analyzed in the first example. You are encouraged to run the code and explore the platform directly to observe the chatbot’s behavior across different interactions.
LangSmith provides a wide range of features that support analysis, debugging, and performance optimization. As shown in this post, its tracing and visualization tools make it possible to clearly understand agent behavior, tool usage, and performance metrics such as latency and token consumption. This level of visibility enables a more systematic and data-driven approach to building reliable LLM applications.

Leave a comment